How Weather Data Patterns Guide Targeted Upkeep Strategies Across Multi-Use Athletic Sites
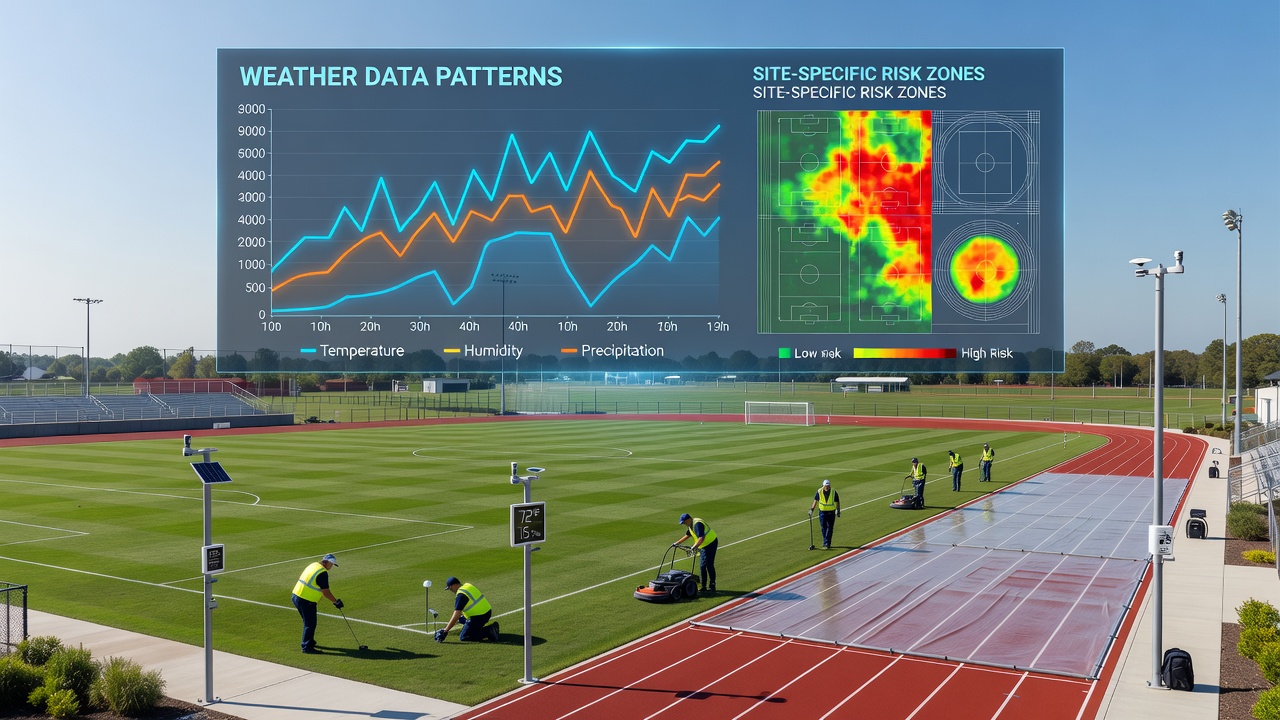
Weather data patterns shape how operators maintain multi-use athletic sites where fields serve soccer, baseball, football, and community events in quick succession. Facilities collect rainfall totals, temperature swings, humidity levels, and wind speeds from on-site sensors along with regional forecasts to time interventions like aeration, irrigation adjustments, and surface repairs. These datasets help crews address wear before it spreads across shared playing surfaces that experience different stresses depending on the sport and season.
Collecting and Interpreting Weather Inputs
Operators integrate local weather stations with satellite feeds and historical records to build profiles of site-specific conditions. Data from sources such as the National Oceanic and Atmospheric Administration reveal seasonal rainfall clusters that saturate root zones, while temperature records highlight freeze-thaw cycles that heave soil in northern regions. Multi-use venues combine these streams into dashboards that flag periods when drainage systems need preemptive clearing or when turfgrass requires extra root-zone protection ahead of heavy use.
What's interesting is how wind patterns factor into equipment decisions. Sustained gusts above certain thresholds dry out infields faster than outfields, prompting crews to adjust watering schedules on baseball diamonds while leaving adjacent soccer pitches untouched. Observers note that facilities tracking these variables over multiple years reduce unplanned closures by aligning maintenance windows with calmer forecast stretches.
Matching Patterns to Surface Types
Artificial turf and natural grass respond differently to the same weather sequence. Prolonged high humidity combined with warm temperatures accelerates microbial growth on synthetic fibers, leading managers to schedule antimicrobial treatments during predicted dry spells that allow surfaces to ventilate. Natural grass fields, meanwhile, show compaction increases after repeated rain events followed by heavy foot traffic, so aeration timing shifts to follow documented dry intervals identified in local climate logs.
Take one facility in a temperate zone that overlays weather archives with usage calendars. Staff discovered that late-spring thunderstorms consistently preceded peak summer programming, so they pre-treated drainage channels and reinforced goal-mouth areas each May. This approach kept fields playable through June 2026 tournament clusters without emergency interventions mid-season.
Building Predictive Maintenance Timelines
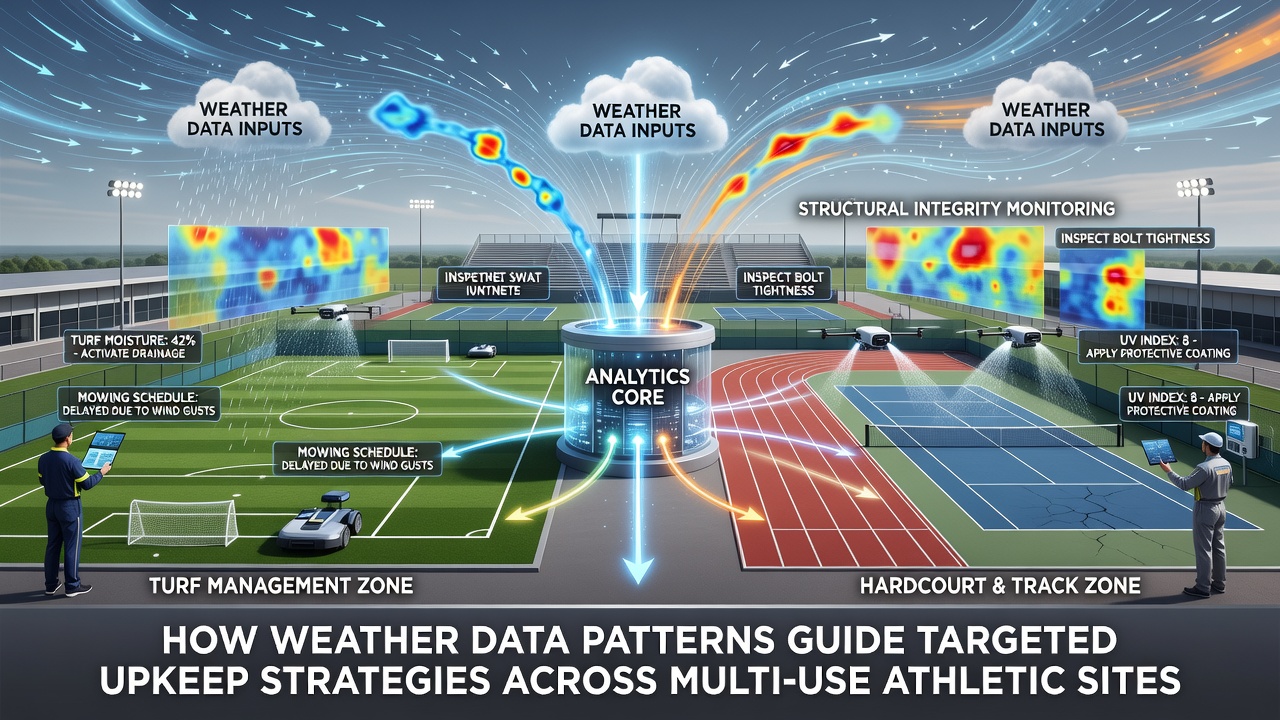
Facilities translate weather patterns into rolling calendars that prioritize tasks according to risk. A cluster of high-wind days followed by rain triggers immediate checks on netting, fencing, and lighting structures, while extended drought periods prompt soil-moisture monitoring and targeted irrigation rather than blanket watering. Research from the Sports Turf Research Institute shows that sites using such layered forecasts cut irrigation volumes by measurable margins while preserving turf density across overlapping sport schedules.
Multi-use demands add another layer because one field's recovery window often overlaps another's peak usage. Operators therefore cross-reference precipitation forecasts with booking systems to shift lower-impact activities to alternate surfaces when models predict saturation risks. This coordination relies on consistent data feeds rather than reactive fixes after damage appears.
Regional Examples and Data Integration
European facilities drawing on records from the European Environment Agency have refined protocols for coastal sites where salt-laden winds accelerate corrosion on metal fixtures. Australian venues, guided by Bureau of Meteorology datasets, time major renovations around documented El Niño cycles that bring extended dry periods ideal for major grading work. North American complexes similarly layer Environment and Climate Change Canada temperature trends with on-site sensors to anticipate ice formation on multi-purpose rinks that double as summer fields.
These approaches share a common thread: they treat weather data as a planning input rather than an after-the-fact explanation. Venues that embed forecasts into work-order systems report fewer conflicts between maintenance crews and event schedules, because tasks move to windows when conditions support effective outcomes.
Conclusion
Weather data patterns supply the factual foundation for upkeep decisions that keep multi-use athletic sites functional across changing demands. By combining localized measurements with broader climate records, operators align interventions with actual environmental sequences rather than fixed calendars. Facilities that embed these insights into daily operations maintain surface consistency while managing resources across diverse sports and community uses.